Like the Earth, the Sun has a magnetic field. It does not end at the solar surface but is carried far out into the solar system by the solar wind. It is therefore called the interplanetary magnetic field (IMF). Only at the edge of the heliosphere, far beyond the planets, does the solar wind meet the magnetic field of interstellar space.
The Sun rotates while the solar wind streams radially outwards. The footpoints of the field lines rotate with the Sun. This creates a spiral pattern, the Parker spiral. It is often compared to the water jet of a lawn sprinkler.
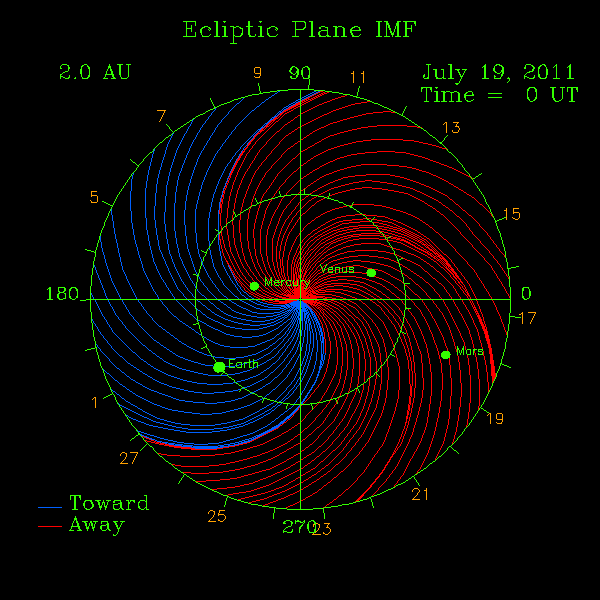
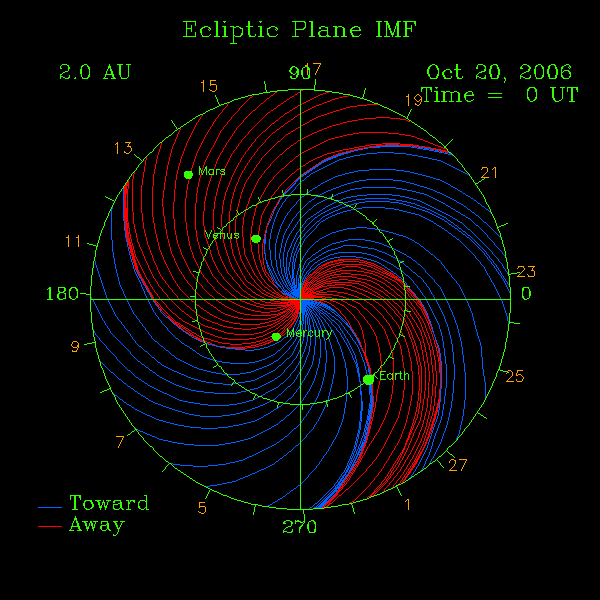
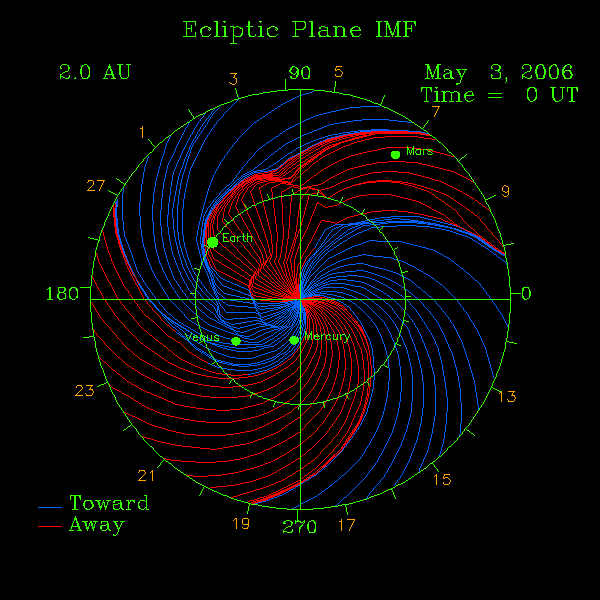
Depending on the polarity, the field lines point away from the Sun (red in the charts) or towards the Sun (blue). Since sunspots and coronal holes bring their own magnetic structures, the IMF is divided into several red and blue sectors. The more active the Sun, the more sectors there are and the more irregular the pattern.

IMF with two sectors. (Chart: EXPI, HAFv2 solar wind model)

IMF with four sectors. The Earth is just crossing a sector boundary. (Chart: EXPI, HAFv2 solar wind model)

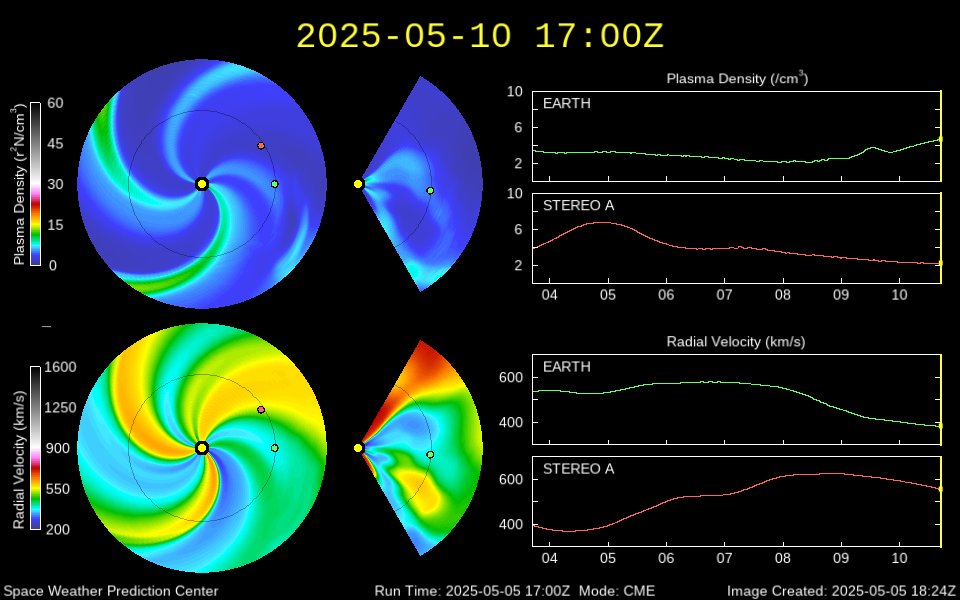
A coronal mass ejection deforms the IMF. (Chart: EXPI, HAFv2 solar wind model)
The direction of the IMF is described by three components. Bx points towards the Sun, By lies across it in the plane of the Earth's orbit and Bz points north or south. The total strength is called Bt. All values are given in nanotesla (nT).
The IMF is measured by satellites at the Lagrange point L1. This point lies about 1.5 million kilometres in front of the Earth in the direction of the Sun. For a long time, the satellites ACE (since 1997) and DSCOVR (since 2016) provided the real time data. Since June 2026, NOAA has mainly used its new satellite SOLAR 1. Depending on its speed, the solar wind needs about 30 to 60 minutes from L1 to the Earth. With very fast solar wind it is only about 20 minutes. This leaves a short warning time.
The most important component is Bz. On the day side, the magnetic field of the Earth points north. If the IMF points south, that is with negative Bz, the field lines of both magnetic fields can connect. This process is called magnetic reconnection. Energy and particles of the solar wind then enter the magnetosphere of the Earth. The stronger and longer Bz points south, the stronger the geomagnetic storm.
The following guide values apply to Germany: with Bz around −5 nT, faint aurora is visible in northern Germany. From about −10 nT, visual aurora is possible all over Germany, from −15 nT also in Bavaria and the Alps. At −20 nT bright substorms can occur, and below −30 nT the aurora can become very bright. During the great storm in May 2024, Bz reached almost −50 nT. What matters is that Bz remains negative for an hour or longer. The faster the solar wind, the stronger the effect of a negative Bz.
Where two sectors of the IMF with opposite polarity meet, there is a thin layer, the heliospheric current sheet (HCS). When the Earth moves from one sector into the next, this is called a sector boundary crossing. It takes a few hours. In the satellite data it can be recognised by the angle phi, which changes by about 180 degrees. During the crossing this value often fluctuates strongly.
If the current sheet lies within the plasma cloud of a CME, the effects are often stronger than with a CME without a sector crossing. Even weak CMEs can thus cause bright aurora. An example is the bright aurora of 27 February 2014.