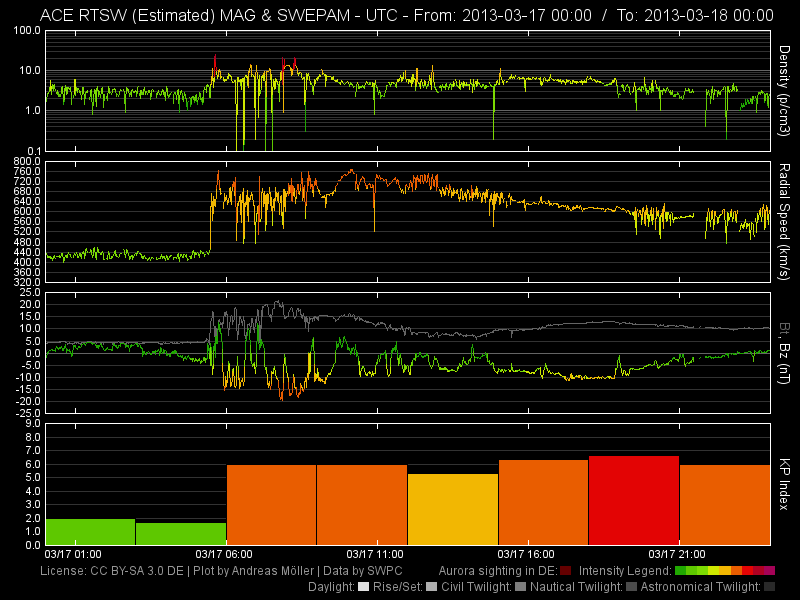
Soon after a flare or a filament eruption it is possible to estimate whether and when a CME will reach the Earth. The first thing that counts is the position of the eruption. The closer it is to the centre of the solar disc, the more likely the CME hits the Earth head on. But glancing blows have also caused aurora in Germany.
Next come the coronagraph images. They show whether a CME has formed, how large it is and how fast it spreads. The SWPC sends out first estimates of the speed in its email alerts. Such a message looks like this, for example:
ALERT: Type II Radio Emission
Begin Time: 2014 Dec 18 2222 UTC
Estimated Velocity: 664 km/s
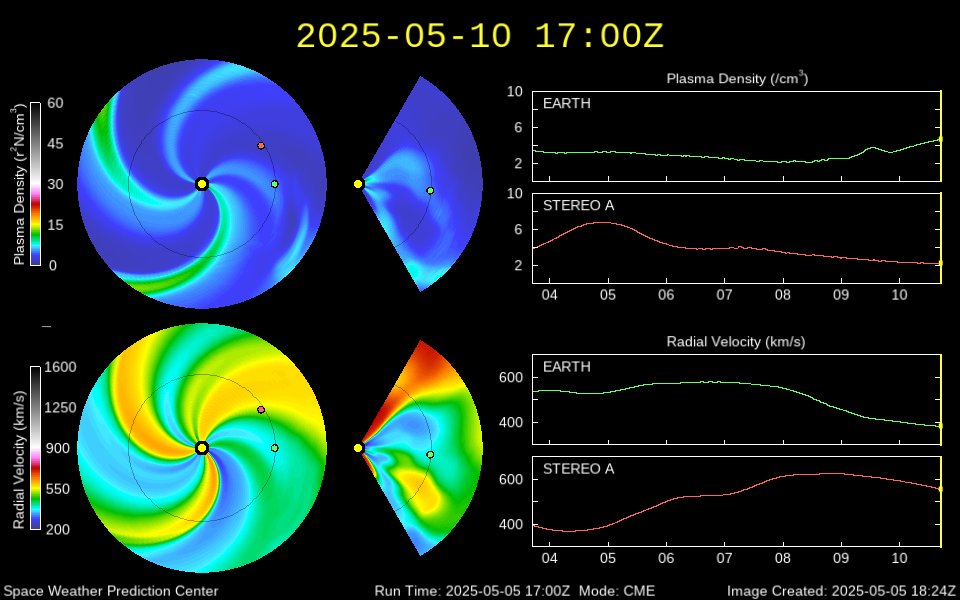
Using these data, models calculate how the CME spreads and when it will arrive. The best known model is WSA Enlil of the SWPC. The NASA CME Scoreboard collects the predictions of many models and research groups. Nevertheless, the arrival time can only be predicted roughly. Deviations of ten hours and more are normal. How strong the storm will be only becomes clear on arrival.
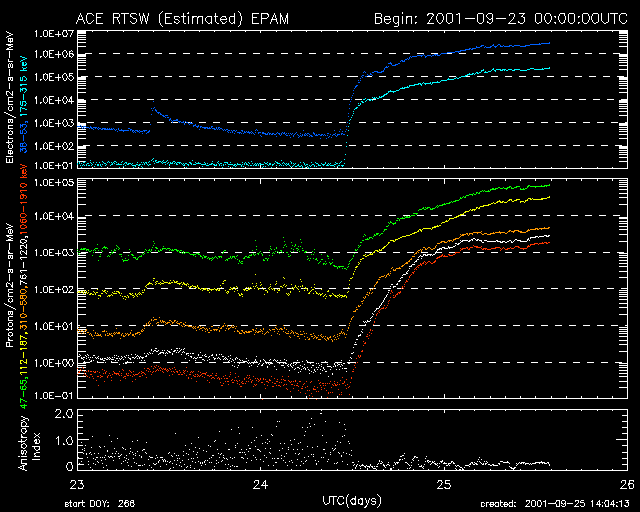
A fast CME pushes a shock front ahead of it. At this shock, particles are accelerated to high energies. Instruments such as EPAM on the ACE satellite measure these electrons and protons. Each curve in the charts stands for one energy range.
When a CME approaches the Earth, the particle flux often rises slowly over many hours. The curves form a ramp. Shortly before the shock front arrives, the values usually shoot up steeply within a few minutes. This final rise announces the arrival of the CME. From this point on, the solar wind data should be monitored closely. Every CME looks different in these data. The ramp is therefore only a hint and not a reliable forecast.
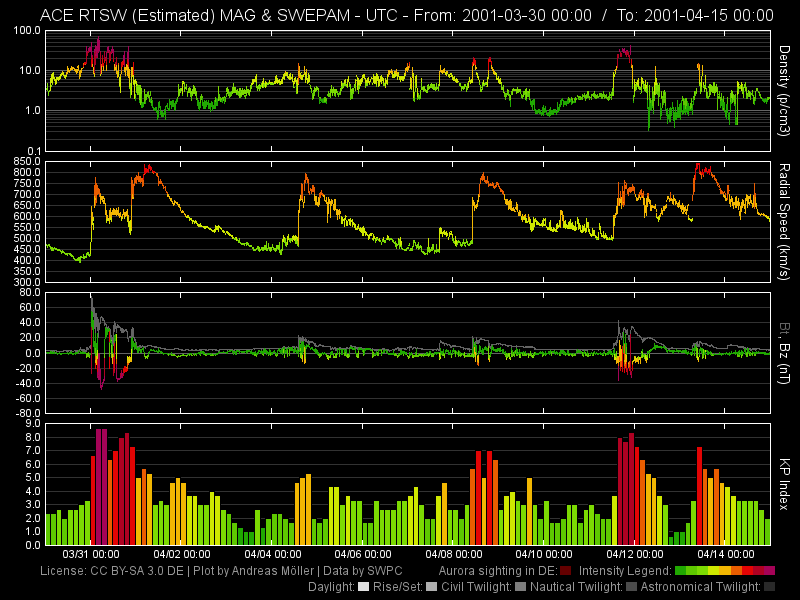
The satellites at the point L1 are the first to register the shock front. In the data, speed, density and magnetic field (Bt) jump up within minutes. This moment is called the impact or shock arrival. Depending on its speed, the shock front reaches the Earth 20 to 60 minutes later.
A CME consists of several parts. Behind the shock front follows a zone of compressed and turbulent solar wind, the sheath. After that there is often a magnetic cloud. In it, the direction of the magnetic field rotates slowly and smoothly over many hours. If the field in the sheath or in the cloud points south for a long time, the storm becomes strong. If it points north, even a fast CME can have almost no effect.
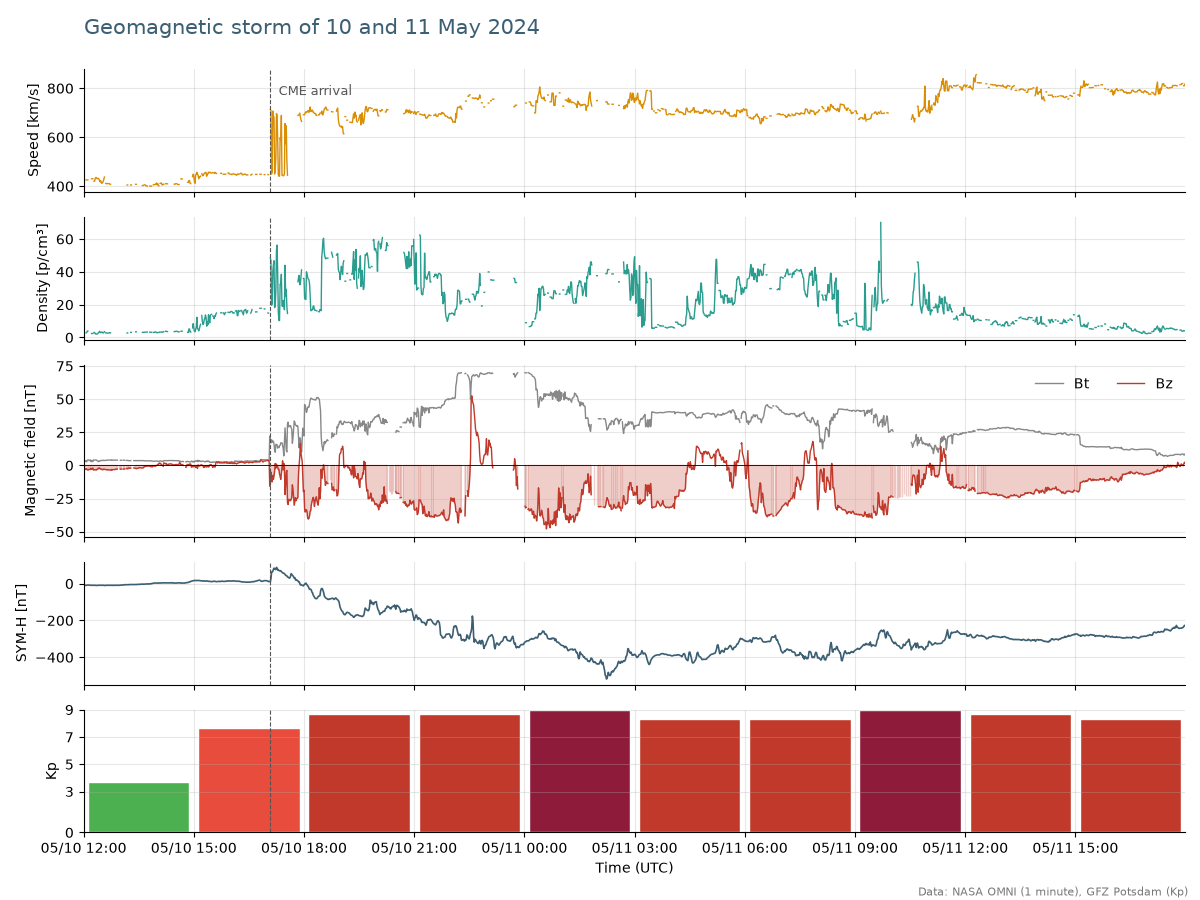
On 10 May 2024 at 17:05 UTC, the first of several CMEs from sunspot group AR 3664 hit the Earth. The speed jumped from about 450 to more than 700 kilometres per second. The magnetic field reached more than 70 nT and Bz dropped to almost −50 nT. Shortly afterwards Kp reached 9. During the following night, bright aurora could be seen all over Germany. It was the strongest geomagnetic storm since October 2003.
As soon as the CME reaches the Earth, it compresses the magnetic field of the Earth. Whether this produces aurora, however, depends above all on Bz. The stronger Bz points south and the longer this lasts, the better the chances. As a guide: with Bz around −5 nT, faint aurora is visible in northern Germany, and from about −10 nT visual aurora is possible all over Germany. From −20 nT bright substorms can occur. At very high solar wind speeds, lower values are sufficient as well.
The strongest Bz values during aurorae in Germany according to the aurora archive:
- 5 and 6 November 2001: Bz −79.5 nT, very bright aurora
- 15 and 16 July 2000: Bz −60.6 nT, extremely bright aurora (Bastille Day event)
- 19 and 20 January 2026: Bz −58.4 nT, extremely bright aurora
- 11 and 12 November 2025: Bz −53.6 nT, very bright aurora as far as the Alps
- 20 and 21 November 2003: Bz −53.1 nT, extremely bright aurora
Magnetic reconnection explains why Bz is so important. The following video of the University of Oslo shows the process from minute 3:00.