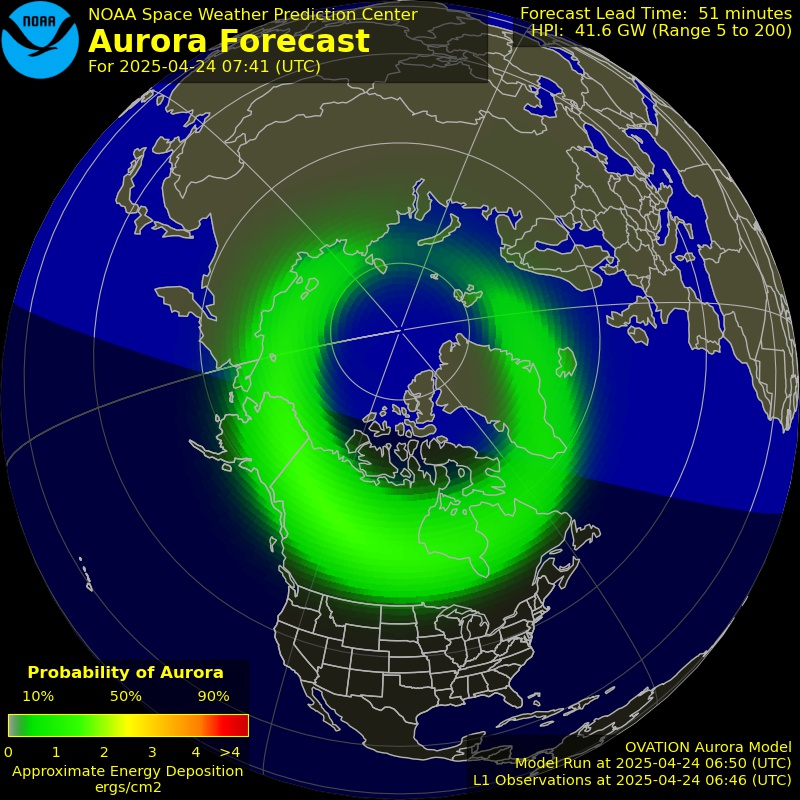
A geomagnetic storm is a strong disturbance of the Earth's magnetosphere. It occurs when the solar wind feeds energy into the magnetosphere for a long time. This happens above all after the arrival of a CME or with fast solar wind from a coronal hole. During the storm, the auroral oval expands towards the south. During strong storms it reaches beyond Germany.
Whether a storm develops is decided by the Bz value of the solar wind. If it points south for a long time, energy enters the magnetosphere through magnetic reconnection. How strong a storm was is described afterwards by the Kp index. Based on it, NOAA divides geomagnetic storms into five levels:
A magnetometer measures the strength and direction of the magnetic field at a location on Earth. It is the most important tool for detecting aurora in real time. Magnetometers are distributed all over the world. A network of several stations shows where the auroral oval is located at the moment. The Tromsø Geophysical Observatory in Norway, for example, operates such a network.
During a geomagnetic storm, the curves of the magnetometers deflect strongly. The larger the deflection, the more likely aurora is. Stations in Scandinavia such as Kiruna are particularly meaningful. If magnetometers in Germany also show clear deflections, aurora on the northern horizon is likely. The local K index summarises the strength of the deflections within three hours. It ranges from 0 to 9.
Live Plot
Magnetometer in Kiruna, Sweden. (Source: IRF, with kind permission)
Live Plot
Magnetometer chain from Svalbard to southern Norway. (Source: UiT TGO, with kind permission)
Live Plot
Magnetometer of the Mömbris observatory in Bavaria. (Source: Sternwarte Mömbris)
The planetary Kp index describes how strongly the magnetic field of the Earth was disturbed worldwide. The GFZ Helmholtz Centre for Geosciences in Potsdam calculates it from the data of 13 observatories at mid latitudes. Every observatory determines its local K index for a period of three hours. Kp is the weighted mean of these values. It ranges from 0 to 9 in thirds, for example 7−, 7o and 7+.
Important: Kp looks back. The value always describes the past three hours and is only final at the end of this period. It says nothing about the current situation or the next hours. By the time a high value is published, the peak of the aurora may already be over. Conversely, aurora can suddenly appear at low Kp when Bz just turns south. For observing, the real time data of Bz and of the magnetometers are what counts. The GFZ indices Hp30 and Hp60 are somewhat faster than Kp. They describe every half hour and every hour, but they also look back.
Kp is well suited for classifying a storm afterwards. Since 2015, aurora has been recorded in Germany on more than 400 nights. On three out of four of these nights, Kp was between 4 and 6. More than half of these aurorae could only be seen in photos. The brightest aurorae almost always occurred at Kp 8 or 9.
The Dst index (disturbance storm time) describes the strength of the ring current. This is an electric current of charged particles that circles the Earth at an altitude of several ten thousand kilometres during a storm. It weakens the magnetic field at the equator. The more negative Dst is, the stronger the storm. Values below −100 nT are considered a strong storm. The World Data Center in Kyoto publishes Dst every hour.
Dst reached its lowest values during the great storm in March 1989 with −589 nT. At that time the power grid of the Canadian province of Québec collapsed for nine hours. During the storm in November 2003 Dst reached −422 nT and in May 2024 −412 nT. For forecasting aurora in Germany, however, Dst is of limited use. During the extremely bright aurora of 19 January 2026, Dst was only −194 nT.
The GOES weather satellites orbit the Earth at an altitude of about 36,000 kilometres on a geostationary orbit. They are usually located within the magnetosphere and measure the magnetic field there. The values vary during the day because the satellite reaches the day side of the Earth once a day and the night side once a day. On the day side, the solar wind compresses the magnetic field. There it is stronger than on the night side. The SWPC shows the current data.
The outer boundary of the magnetosphere is called the magnetopause. On the day side it is normally about 60,000 kilometres above the Earth. A very strong CME can compress it so much that it lies closer to the Earth than the orbit of the GOES satellites. The satellites are then outside the magnetosphere in the transition zone to the solar wind, the magnetosheath. The measured field strength suddenly drops sharply and often even becomes negative. Such a magnetopause crossing is a sure sign of a violent storm and strong aurora.
From Kp and the solar wind data, the SWPC continuously calculates the position and brightness of the auroral oval. The OVATION model shows the probability of aurora during the next 30 to 90 minutes. If the red edge of the oval lies over Scandinavia or further south, aurora may be visible on the northern horizon in Germany.