Shortly after a flare or a filament eruption has occurred, it is already possible to estimate the arrival time of a potential CME or the strength of the geomagnetic storm. To do this, the first thing to look at is the position on the sun from which the CME originated. The more centrally the CME originated, the more likely it is to fully hit the Earth. But glancing blows (like on 15.03.2012, for example) have also triggered auroras.
Another indication of the characteristics of a CME is the density and speed of the ejected particles. These can be observed a few hours after the occurrence of a flare in the images of the SOHO satellite. Whether there was a CME and how dense it is can be read from the images of the LASCO instruments . The speed of the CME is regularly issued in email alerts by the SWPC. Such an alert might look like this:
ALERT: Type II Radio Emission
Begin Time: 2014 Dec 18 2222 UTC
Estimated Velocity: 664 km/s
NASA provides models that simulate the trajectory of the CME and predict the possible arrival time. One of these models is the GODDARD model (from ISWA), and another model is provided by the SWPC. In general, it can be said that a CME is usually slower than predicted.
Waiting for the CME

Predicted arrival of a CME on 14.07.2012
EPAM
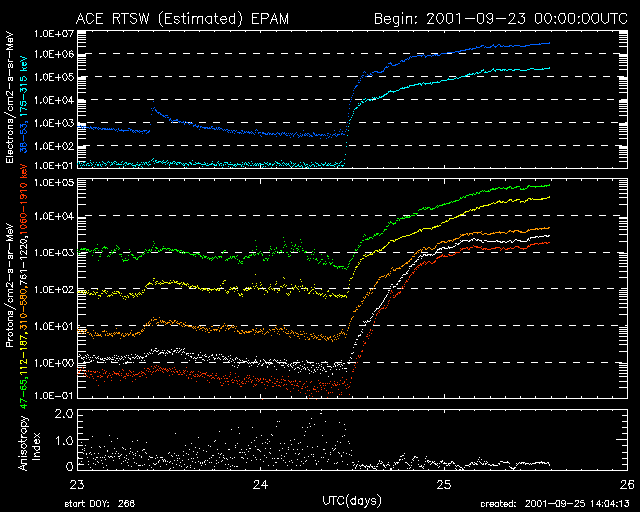
The EPAM (Electron, Proton, and Alpha Monitor) is a measuring device on the ACE satellite that measures the electron and proton density of the solar wind. Each colored graph represents an energy level. The following graphic shows the EPAM's measurement results for the last 6 hours or 3 days. The upper area (turquoise and blue graph) describes the electron density, and the lower area has 5 graphs (red, orange, yellow, white, and green) which represent the proton density of the solar wind.
Live Plot

EPAM of the last 6 hours
Live Plot

EPAM of the last 3 days
When the sun hurls a CME towards Earth, the EPAM provides the first signs of the shock front's arrival. The proton density steadily increases until the shock front arrives. The graphs form a ramp. The appearance of the ramp follows no particular characteristic, but always looks different. However, all graphs share that they suddenly rise shortly before the shock front arrives. This rise is also referred to as the "final rise".
As soon as the upper graph exceeds the energy level of 10,000 protons/cm² (1.0E+05), one should be vigilant. It can happen that the CME passes the ACE satellite within the next few hours. However, this value is only a guideline! The CME may also arrive earlier or later.
As already mentioned, the "final rise" in the EPAM signals the arrival of the CME. The final rise is recognized by a sharp increase in proton density within minutes and the graphs shooting steeply upward. From now on, the speed of the solar wind should be kept in mind.
Arrival of the CME
The term Impact refers to the arrival of the CME at Earth or the ACE satellite. It's called Impact because the speed of the solar wind suddenly increases. The ACE satellite, our sentinel in space, is the first to register the arrival of the shock front. It records a sharp increase in the speed of the solar wind and fluctuations in the magnetometers. After that, it takes about 15-30 minutes for the CME to reach Earth.
The following two plots show the real-time data (from top to bottom: density, solar wind speed, Bt & Bz values) from the ACE satellite. The data comes from the SWPC.
Live Plot

Data from the ACE satellite (6 hours)
Live Plot

Data from the ACE Satellite (3 days)
When a CME has arrived at the ACE satellite, one should definitely keep an eye on the values here. A high solar wind speed and density are good conditions for auroras in our latitudes.
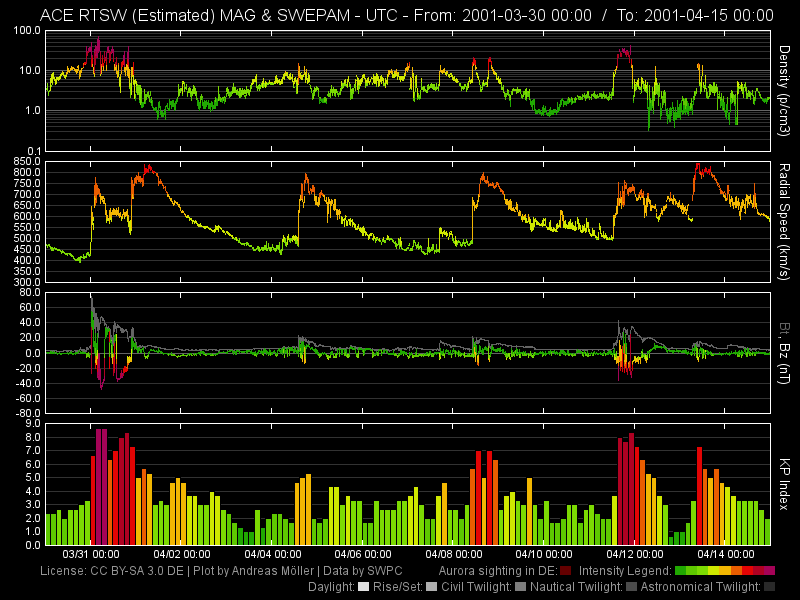
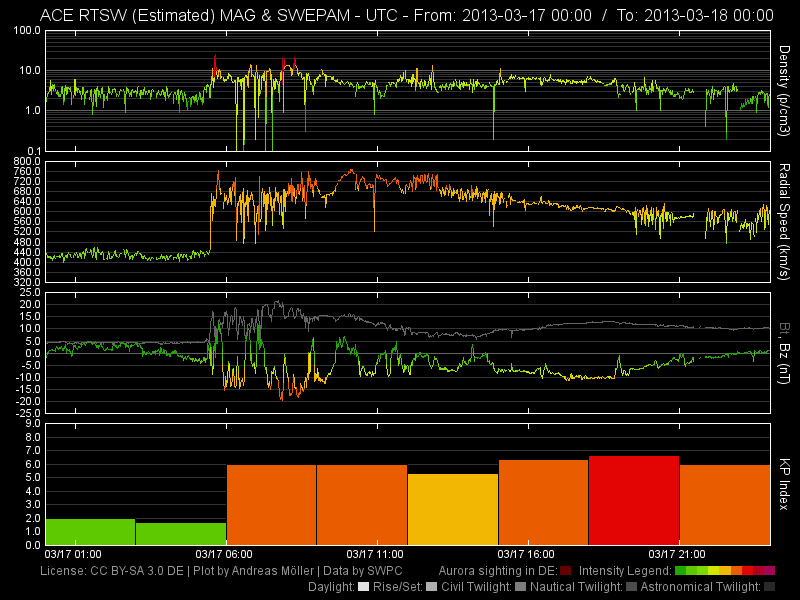
The following examples show how the graphs may look when a CME passes the ACE satellite. In the first example, the CME arrived at around 18:30 UT. This is recognized by the ACE satellite recording a sudden increase in solar wind speed from approximately 650 km/s to about 800 km/s. The second image clearly shows how several shock fronts passed the satellite in April 2001.
The arrival of a CME is indicated not only by the sudden increase in solar wind speed. The strength and orientation of the IMF also change with the arrival of the CME. The strength and orientation of the Z-component (as this is the most important) can be read on the lowest plot of the ACE satellites. The Bt value (gray graph in the lowest plot), that is the total strength of the magnetic field, rises.
Since nature doesn't always comply with textbooks, no CME is perfect. It can happen that the particle speed increases to a high level, but the magnetic orientation of the IMF remains completely unaffected. A high speed of the solar wind does cause the Earth's magnetic field to compress, but a negative orientation of the Z-component in the IMF is necessary (Bz value) for the solar wind particles to penetrate our atmosphere.
The Bz Value
Once the CME has arrived at Earth, it becomes geoeffective and alters the Earth's magnetosphere and ionosphere. The Earth's magnetic field is distorted and compressed from the direction of the solar wind.
Special attention should now be paid to the Bz value . This value is crucial for the occurrence of auroras at our latitudes. The smaller this value is and the longer the Bz index remains in the negative range, the higher the probability of seeing auroras. Roughly speaking, if the Bz value is about -10nT for several hours, auroras can be observed in Germany. With a Bz value of -20nT, strong substorms are already possible. Additionally, the particle density and speed of the solar wind also play a role. If the solar wind presses against the Earth's magnetic field at over 1000km/s, it is practically pushed away. During the strongest aurora events in 2001 or 2003, the Bz value reached about -50nT. Here is a list of the TOP3 auroras sorted by their Bz values.
- 05./06.11.2001 - very bright aurora (Bz: -79.5nT)
- 15./16.07.2000 - extremely bright aurora (Bz: -60.6nT)
- 07./08.11.2004 - very bright aurora (-50.7nT)


