X-rays
| Klasse | NOAA-Klassifizierung |
| < M1 | - |
| M1 - M5 | R1 - Minor |
| M5 - X1 | R2 - Moderate |
| X1 - X5 | R3 - Strong |
| X5 - X10 | R4 - Severe |
| > X10 | R5 - Extreme |
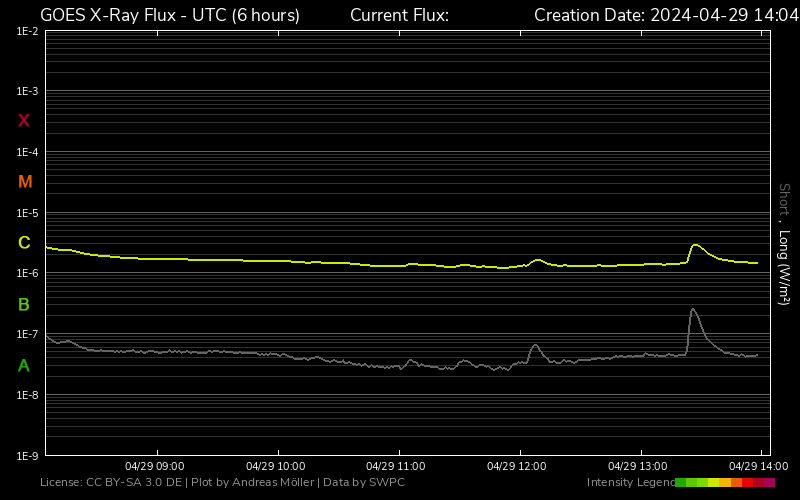
GOES X-Ray Flux (6 hours)
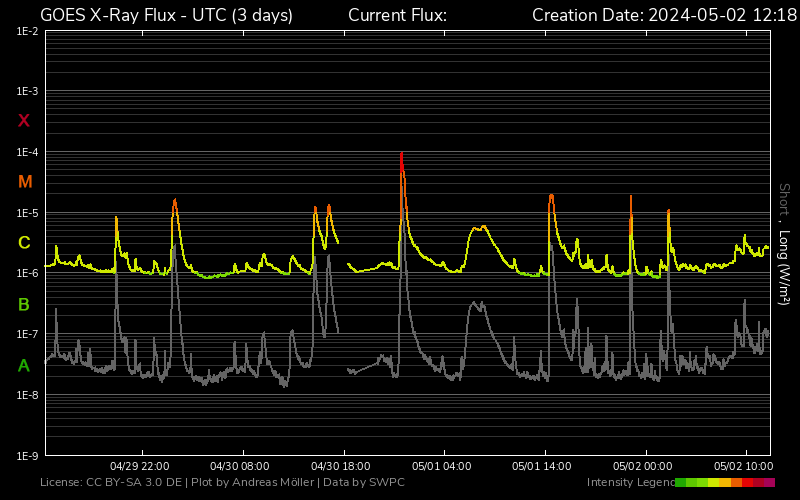
GOES X-Ray Flux (3 days)
X-ray flares (X-Ray Flares)
Flares are eruptions on the solar surface where radiation (including X-rays) is emitted and material (particles) is expelled, known as coronal mass ejections (CME). The X-rays travel at the speed of light and can be measured by satellites a few minutes after the eruption. These outbreaks appear in the diagrams of the GOES satellites as a sudden rise in the curve and end in a "peak". The more intense an eruption, the more the peak shifts into the red area. The peak of the peak is considered
The particles, on the other hand, take about two days to reach the Earth and can then cause auroras. Not every eruption results in a CME. For the aurora to occur, as much material as possible should be hurled toward Earth.
The occurrence of auroras depends on the following factors, among others:
- Flare class
If an X-Class Flare has occurred, the further development should definitely be monitored. Often, shortly thereafter, an aurora alert or a watch is issued. But even M or even C-class flares have already caused auroras. - Flare duration
The longer a flare lasts, the more energy is released. In the case of extremely prolonged flares, they are called Long Duration (LD) Flares.
Example: LD Flare on 22.09.2011
In contrast a very short flare. - Speed
The faster the mass ejection is moving, the higher the chances for auroras on Earth. The SWPC regularly provides speed analyses in their warnings for current flares. - Direction
The more central a flare occurs, the more likely it is that the expelled material flies toward Earth. If a CME is seen completely encircling the solar disk on the LASCO C2/C3 instrument of the SOHO satellite, it is called a so-called Full-Halo CME.
Impulsive Flares
Long Duration (LD) Flares
Hyder Flares
Examples of X-ray Flux


Coronal Mass Ejection (CME)
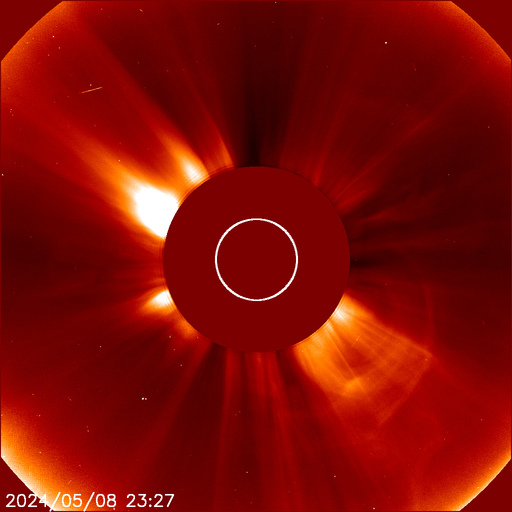
SOHO - LASCO C2
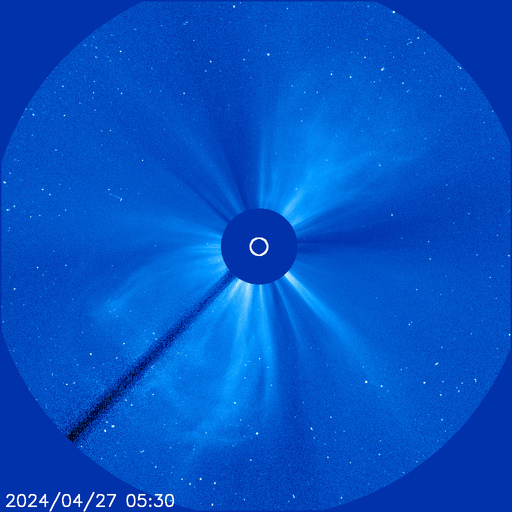
SOHO - LASCO C3
Examples


