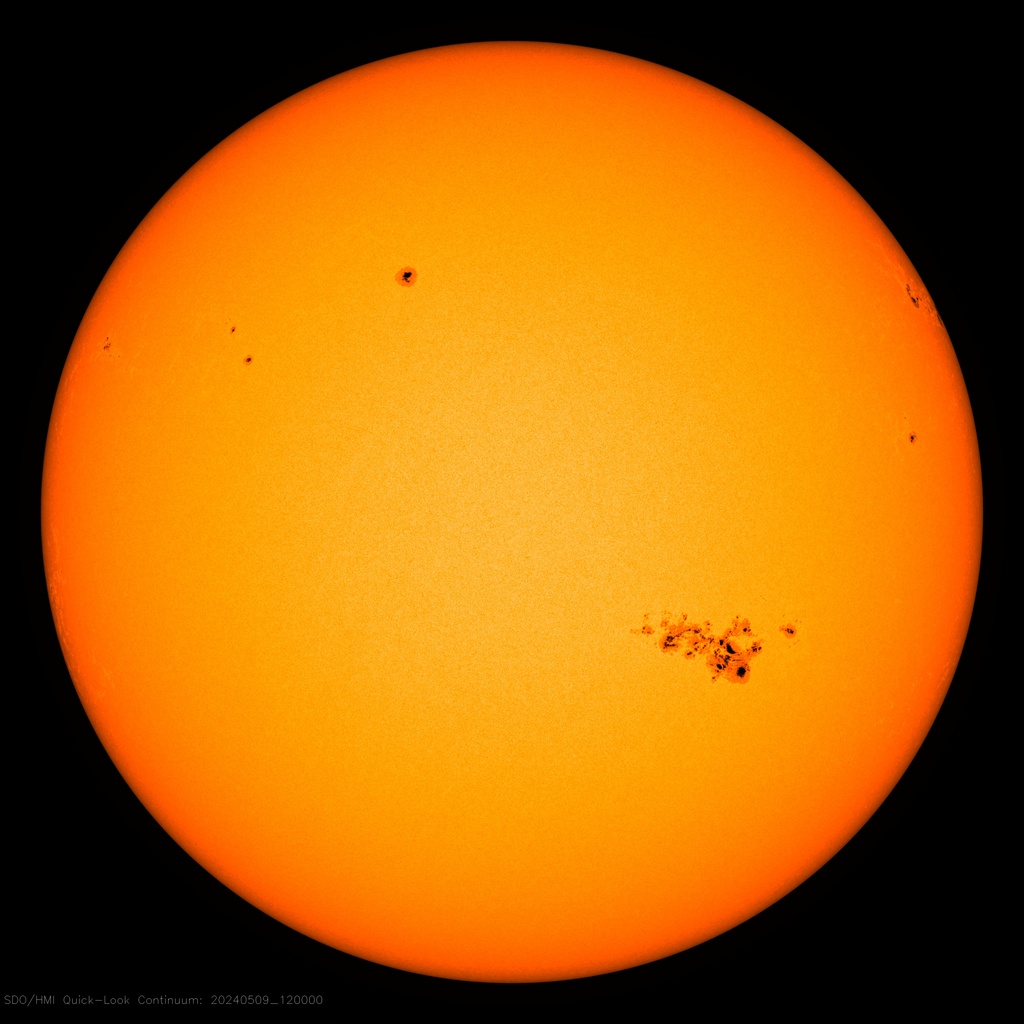
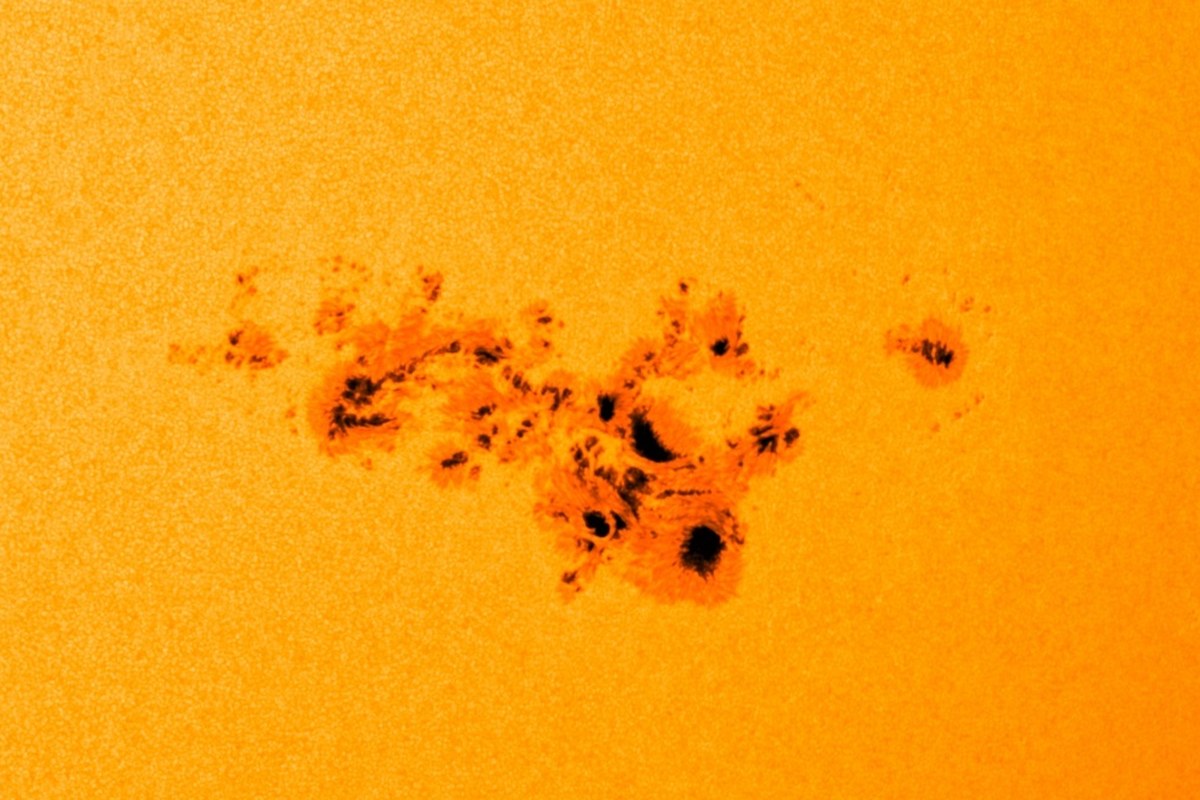
Sunspots are dark areas on the visible surface of the Sun, the photosphere. Strong magnetic fields emerge there from the interior of the Sun. They slow down the transport of heat from below. A spot is therefore 1000 to 2000 degrees cooler than its surroundings and appears dark. A sunspot consists of a dark core, the umbra, and a brighter surrounding, the penumbra.
Sunspots usually appear in groups. These groups are called active regions and are numbered by NOAA. In complex groups the magnetic fields become twisted. When the stored energy is released, flares and coronal mass ejections occur. They cause the strongest aurorae in Germany.
The magnetic classification according to the scheme of the Mount Wilson Observatory describes how complex a sunspot group is. The more complex a group, the more likely it is to produce strong flares. The classes are:
- Alpha (α): group with only one magnetic polarity
- Beta (β): group with a positive and a negative polarity that are clearly separated
- Gamma (γ): group with polarities so irregularly distributed that it counts neither as alpha nor as beta
- Beta gamma (βγ): group in which no simple line can be drawn between the polarities
- Delta (δ): umbrae of opposite polarity lie within one common penumbra
- Beta delta (βδ), beta gamma delta (βγδ) and gamma delta (γδ): groups of class beta or gamma that also contain one or more delta spots
Groups of class beta gamma delta are the most dangerous. Group AR 3664 also belonged to this class in May 2024. It produced several X class flares. The SWPC publishes the current classification of all groups every day.
The number of sunspots varies in a cycle of eleven years on average. A cycle begins at the minimum. Then the number of spots rises, reaches a maximum and falls again. Sometimes a cycle has two peaks, for example cycle 23.
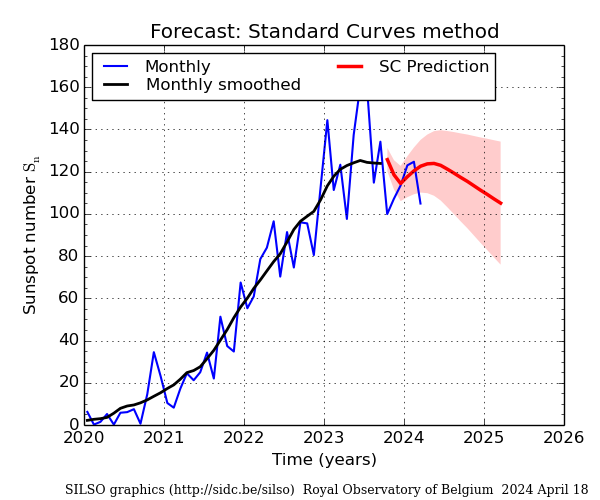
The current cycle 25 began in December 2019. According to the world data centre SILSO in Brussels, it reached its maximum in October 2024 with a smoothed sunspot number of about 161. It was clearly stronger than cycle 24 and stronger than originally predicted. Since 2025, activity has been decreasing again.
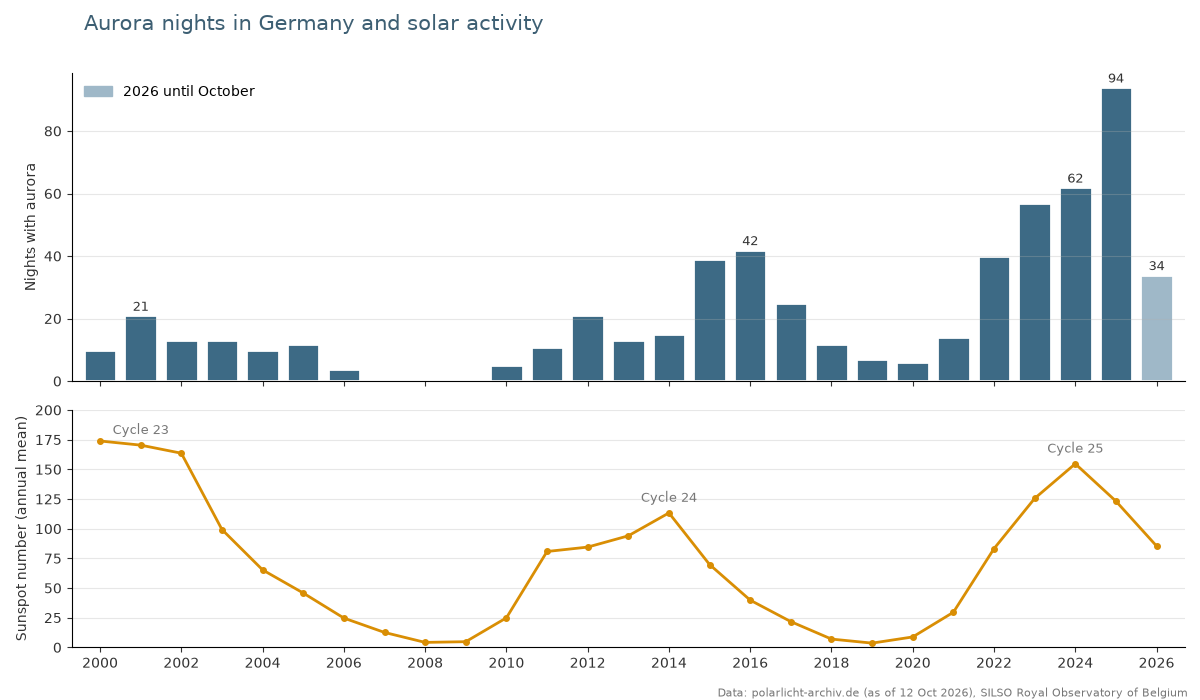
The table shows the smoothed sunspot number according to SILSO. The chart below shows the course of the current cycle and the forecast for the coming months.
At the maximum of a cycle there are the most flares and coronal mass ejections. The chance of very bright aurorae is greatest then. But the chart also shows: the most aurora nights often occur only in the years after the maximum. Then large coronal holes again and again produce fast solar wind. This was the case in 2015 and 2016 and also in the record year 2025. Some of the strongest storms also occurred after the maximum, for example in October 2003, in November 2025 and in January 2026.
Part of the increase since 2015 is also due to modern cameras and smartphones. They show faint aurora that nobody would have noticed before.